Workflow Visualisation for Spatial Data Delivery System
Workflow Visualisation for Spatial Data Delivery System
 PROJECT LINKPROJECT LINK
Challenge: The British Geological Survey (BGS) struggled with scattered legacy spatial data across corporate drives, making it difficult for internal teams and external users to find reliable, current datasets. Staff wasted significant time searching for data, verifying versions, and determining usage rights.
Solution: I collaborated with developers, database specialists, and GIS experts to visualise the workflow that transforms how BGS manages and delivers spatial data through the Spatial Data Delivery Service (SDDS).
As the workflow designer, I worked closely with a cross-functional team including:
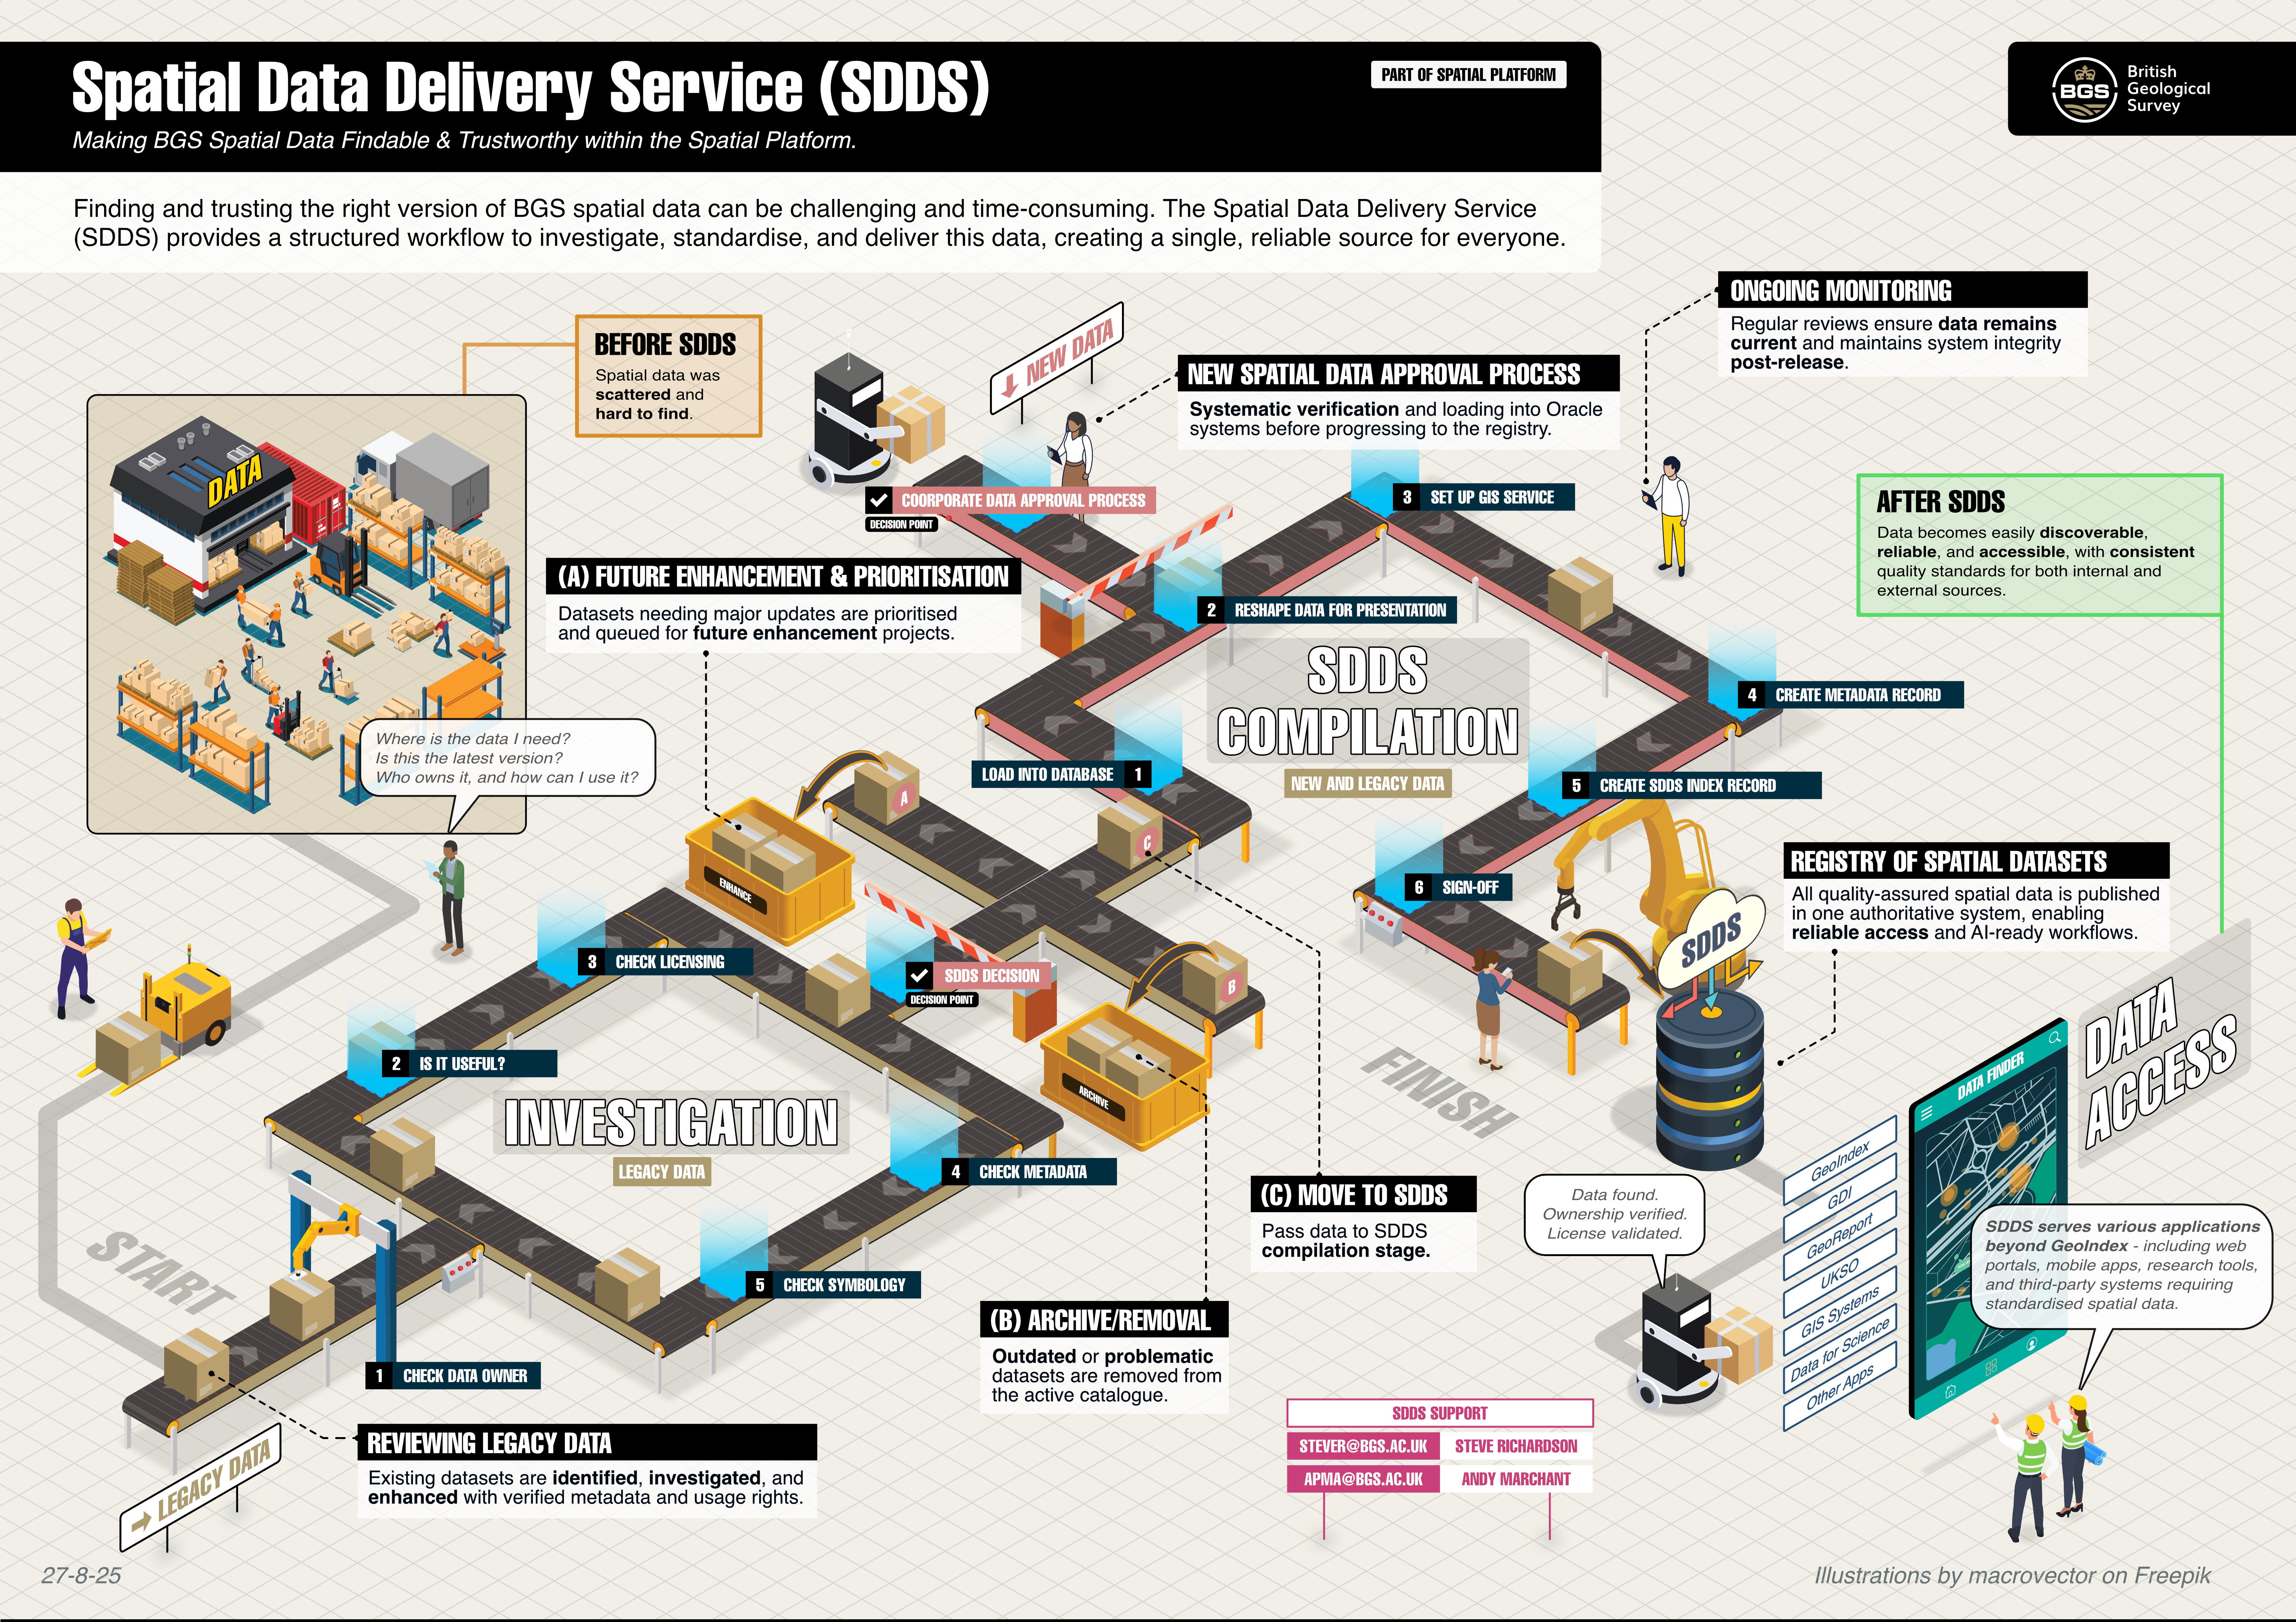
The workflow I designed includes two parallel tracks:
Legacy Data Investigation Track:
New Data Approval Process:
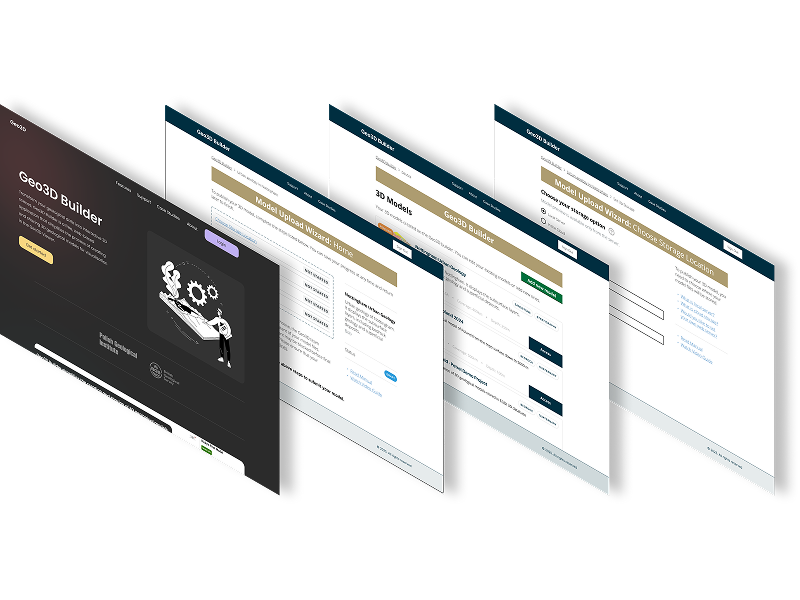
Designed a visual workflow that makes the complex SDDS process transparent and understandable, helping stakeholders see how corporate spatial data is captured, stored, and delivered—ultimately making data more discoverable and AI-ready.
This workflow now serves as the foundation for BGS's spatial data management, ensuring reliable access to geological data for research, policy, and commercial applications.
Created a visual workflow representation that clearly communicates the complex Spatial Data Delivery Service (SDDS) process.
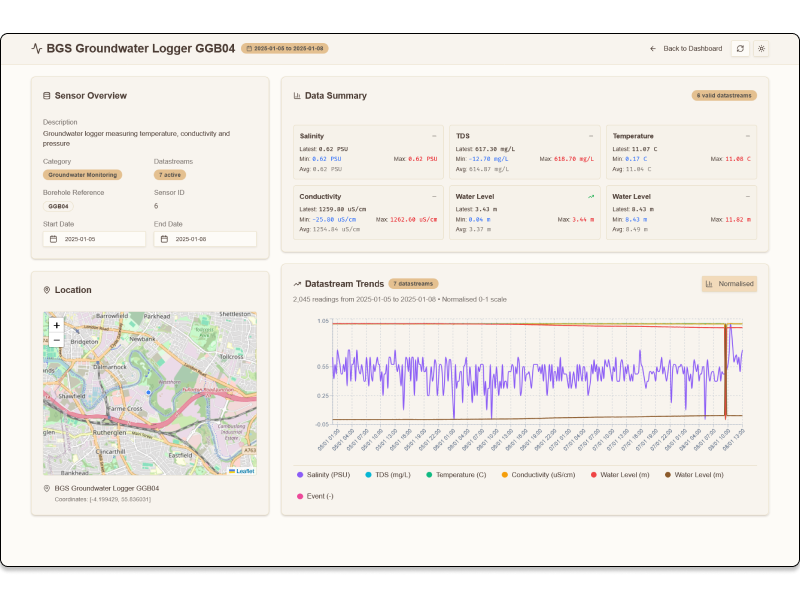
This case study demonstrates how user-centered design, rapid prototyping, and modern development tools can transform complex environmental data into accessible, actionable insights for diverse user groups.
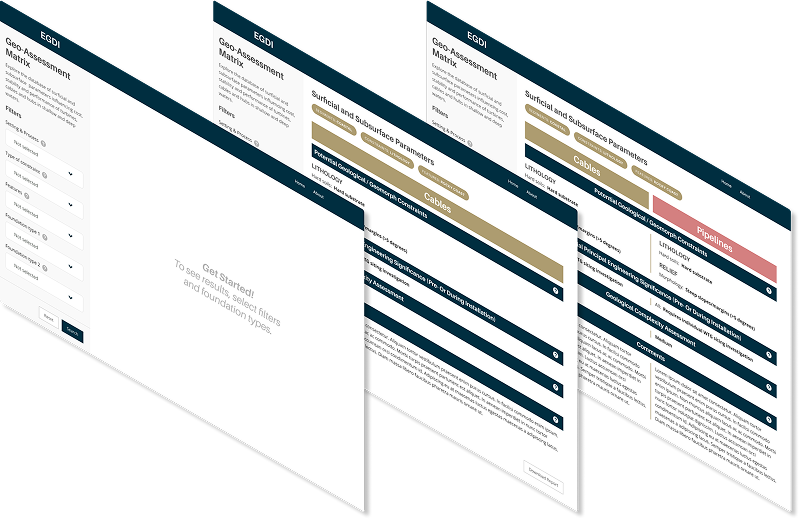
The offshore wind industry needed a simplified, accessible tool to compare geological features for foundation siting decisions. Existing geological assessment data was locked in complex Excel spreadsheets, making it difficult for wind farm developers to quickly evaluate and compare site conditions across different geological environments.
Transforming dense policy research into engaging, actionable insights for government stakeholders and industry professionals