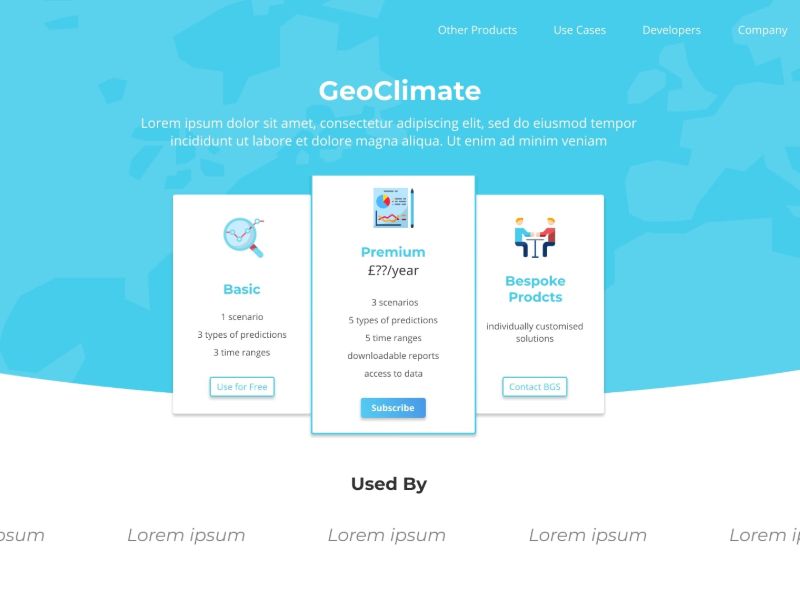
This is a GIS tool to explore predictive shrink-swell models in the UK.
I met with the stakeholders to better understand the data available and the potential user groups of such tools.
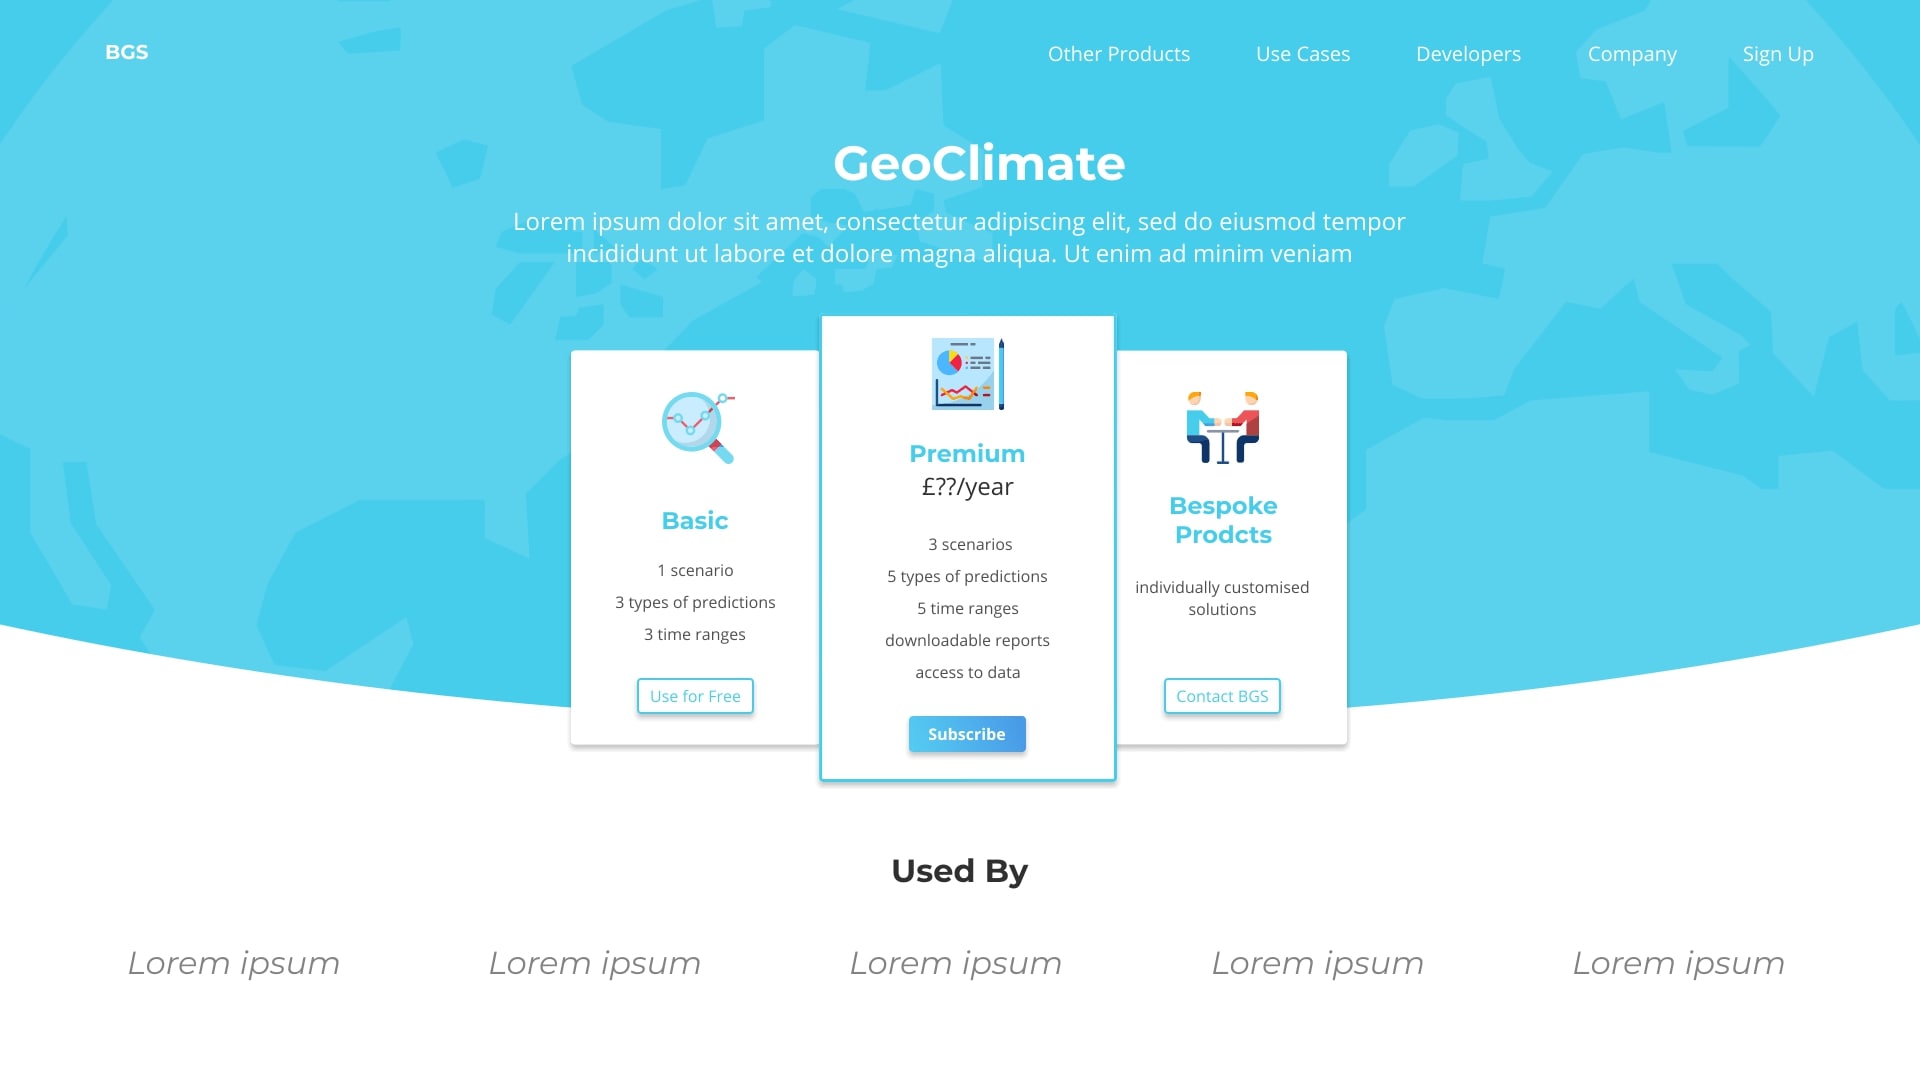
Then I created an interactive prototype using Webflow and integrated google maps to make it look more like the end tool.
Webflow merges the coding and design really well. It doesn't rely solely on coding so you can prototype ideas much quicker. But it has the benefit of code to add more sophisticated interactions to your prototypes.
It also allows to export html, css and js code that can be hosted somewhere else. I really got to like this tool and I'm excited to see it evolve further. It also recently integrated the new CSS grid capabilities so creating more advance layouts is even easier now.
The prototype can be previewed here.
-min.jpg)
-min.jpg)

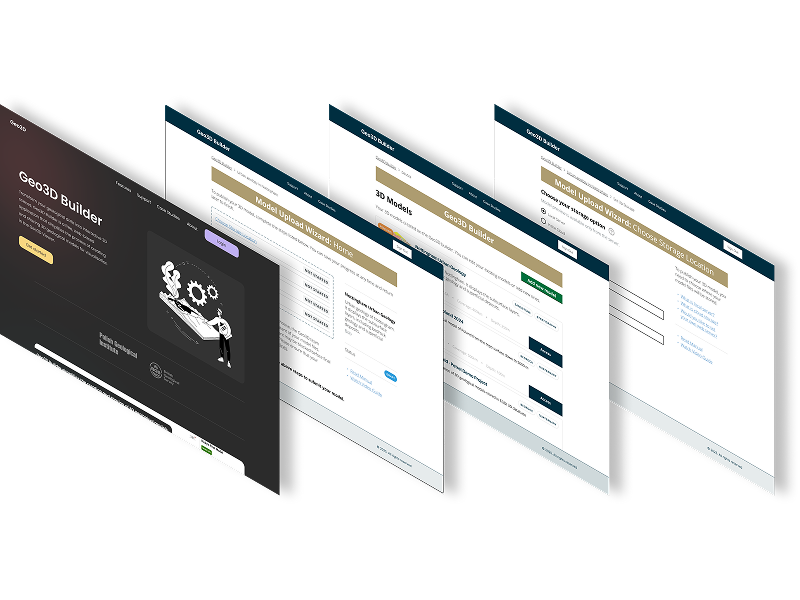
Created a visual workflow representation that clearly communicates the complex Spatial Data Delivery Service (SDDS) process.
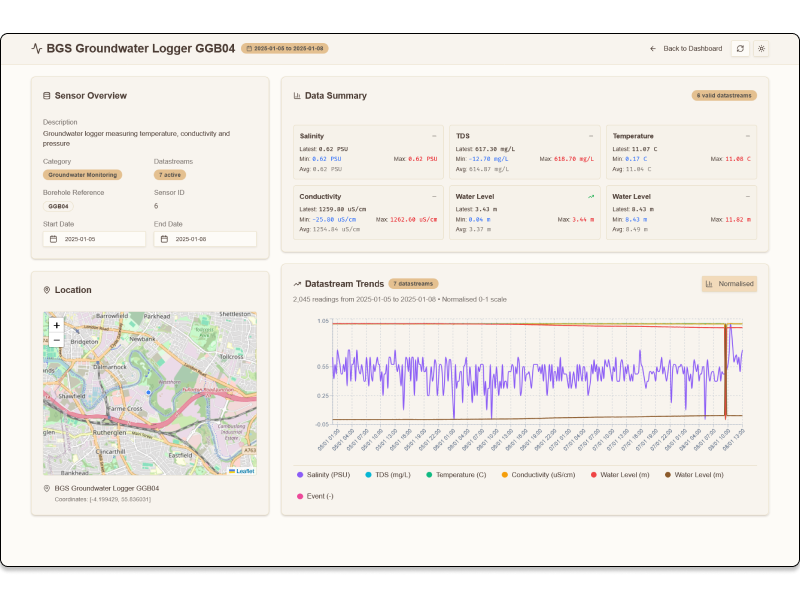
This case study demonstrates how user-centered design, rapid prototyping, and modern development tools can transform complex environmental data into accessible, actionable insights for diverse user groups.
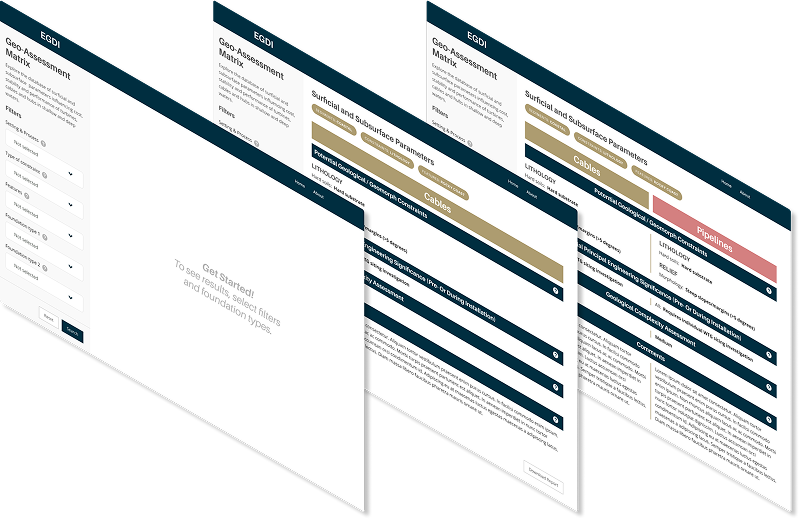
The offshore wind industry needed a simplified, accessible tool to compare geological features for foundation siting decisions. Existing geological assessment data was locked in complex Excel spreadsheets, making it difficult for wind farm developers to quickly evaluate and compare site conditions across different geological environments.
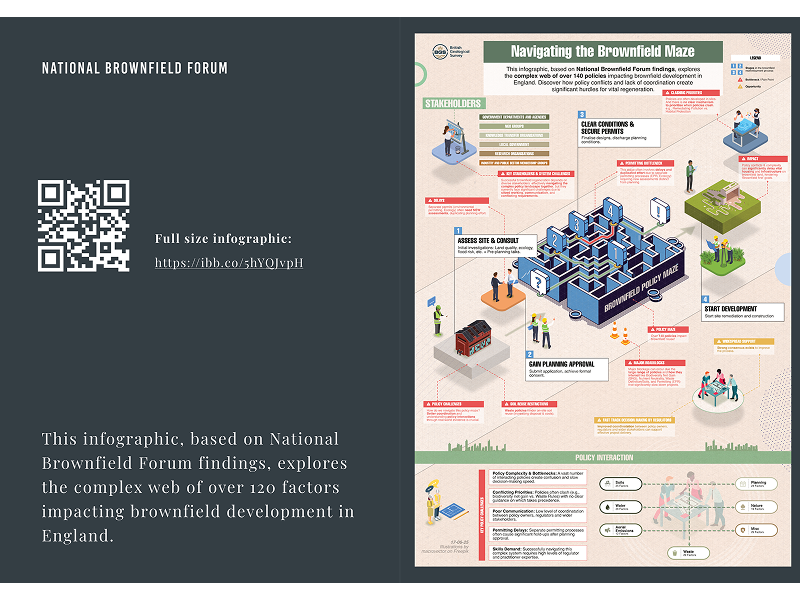
Transforming dense policy research into engaging, actionable insights for government stakeholders and industry professionals