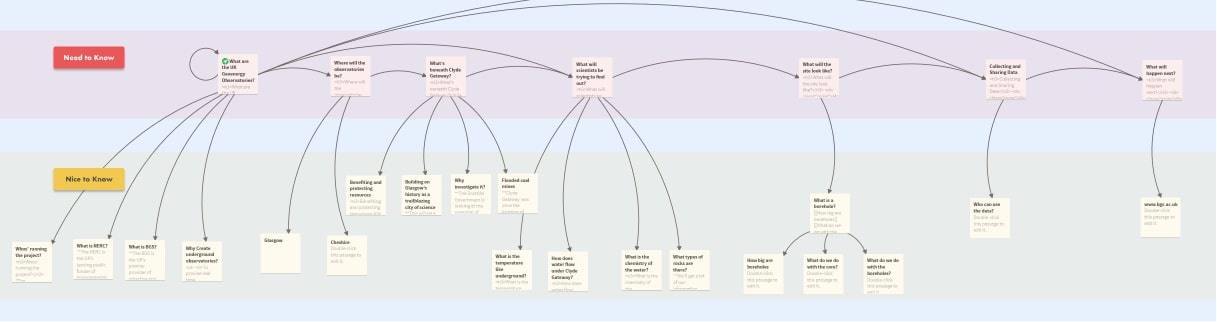
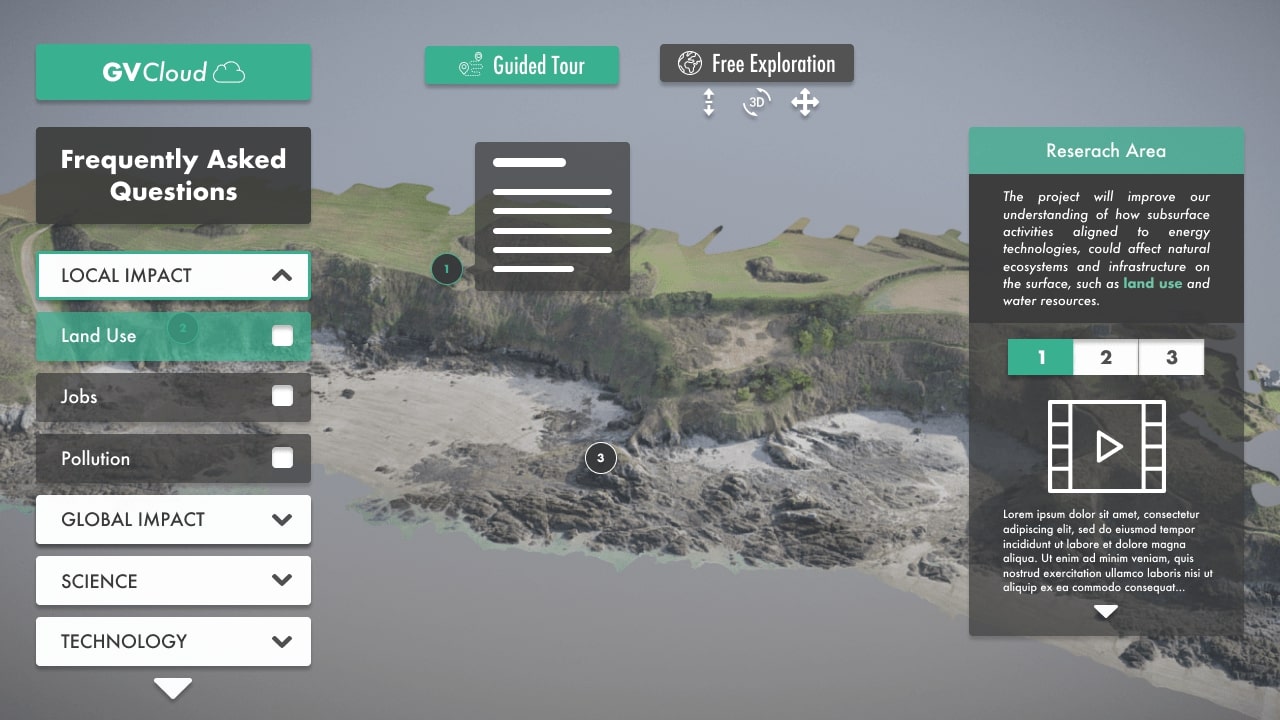
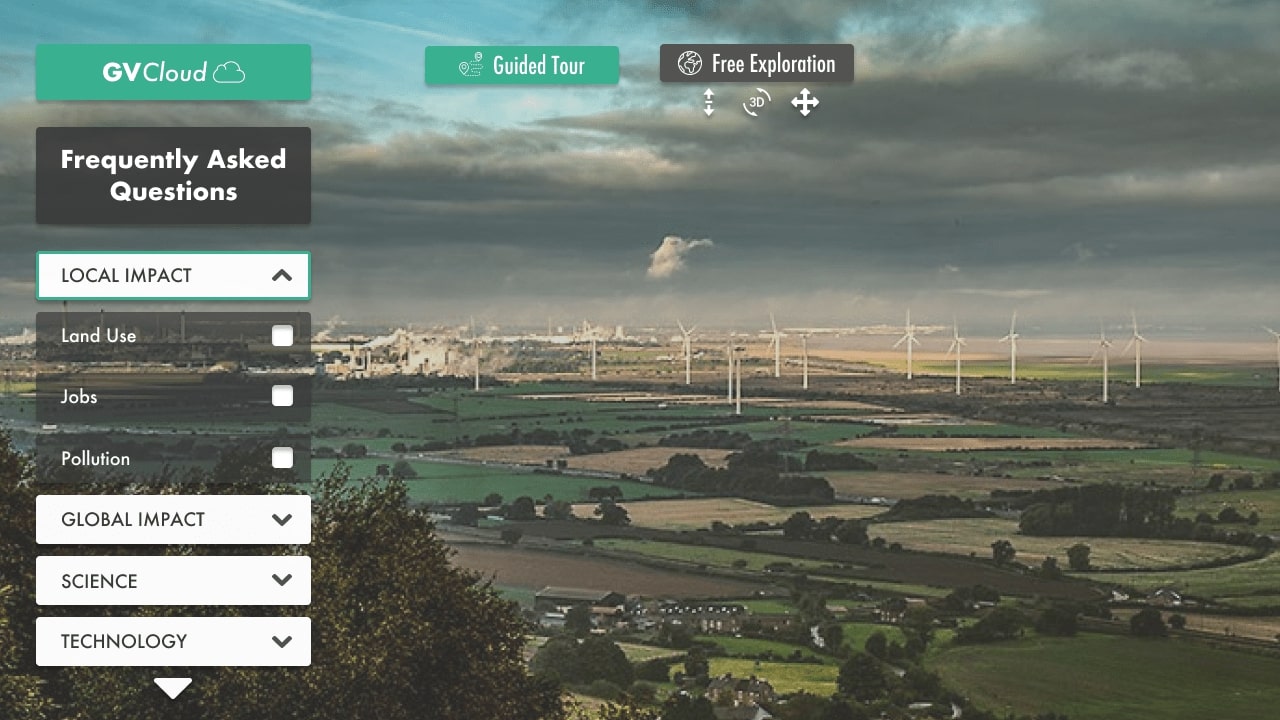
The objective of this project was to create and test an interactive tour of an underground observatory location, targeting various user groups including the public, academics, industry, and students. By grouping frequently asked questions (FAQs) specific to each user group and offering different tour durations of 3, 7, or 15 minutes, users could customize their experience. Using the Twine tool, I visualized user journeys with branching paths to accommodate different content preferences.


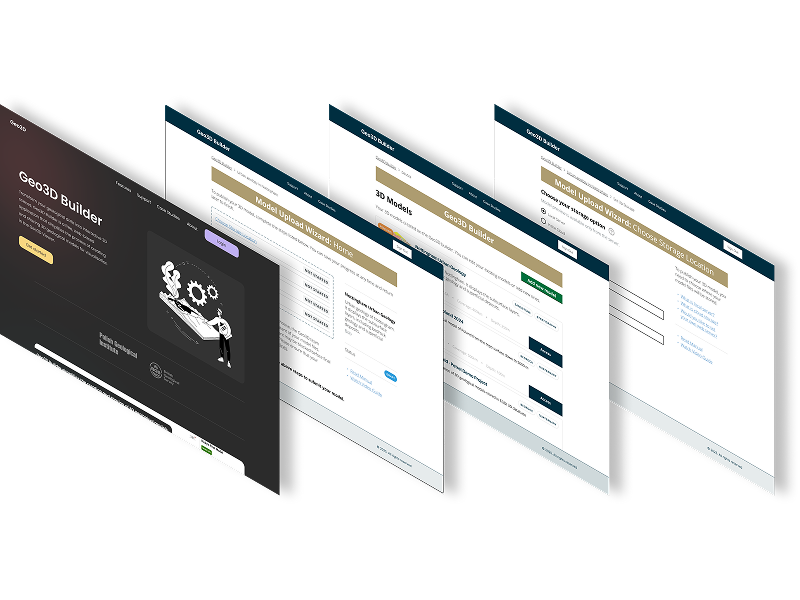
Created a visual workflow representation that clearly communicates the complex Spatial Data Delivery Service (SDDS) process.
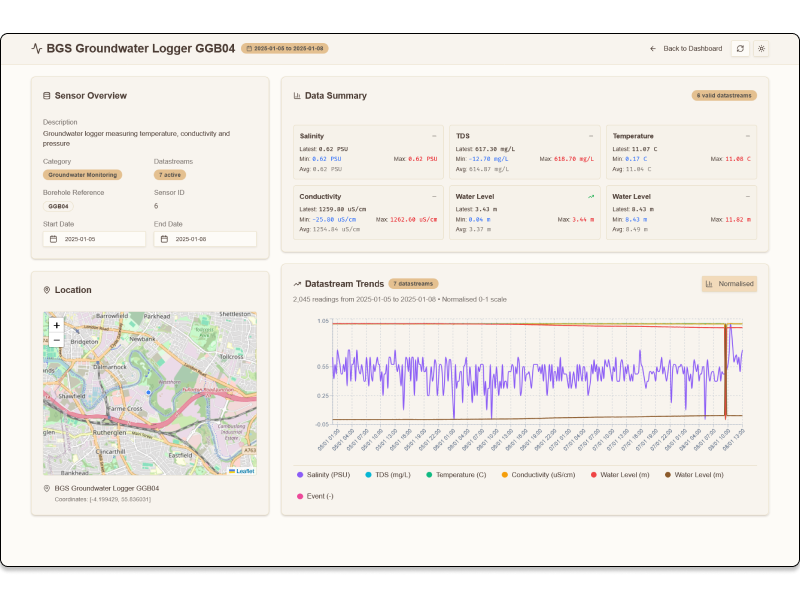
This case study demonstrates how user-centered design, rapid prototyping, and modern development tools can transform complex environmental data into accessible, actionable insights for diverse user groups.
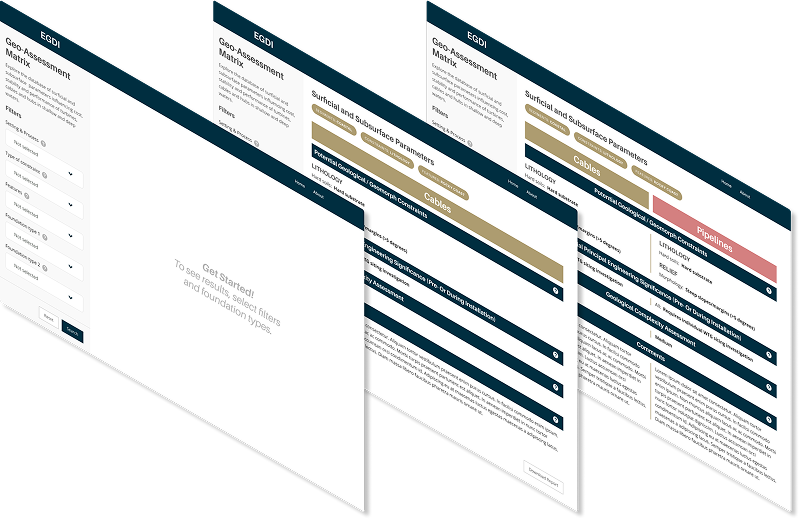
The offshore wind industry needed a simplified, accessible tool to compare geological features for foundation siting decisions. Existing geological assessment data was locked in complex Excel spreadsheets, making it difficult for wind farm developers to quickly evaluate and compare site conditions across different geological environments.
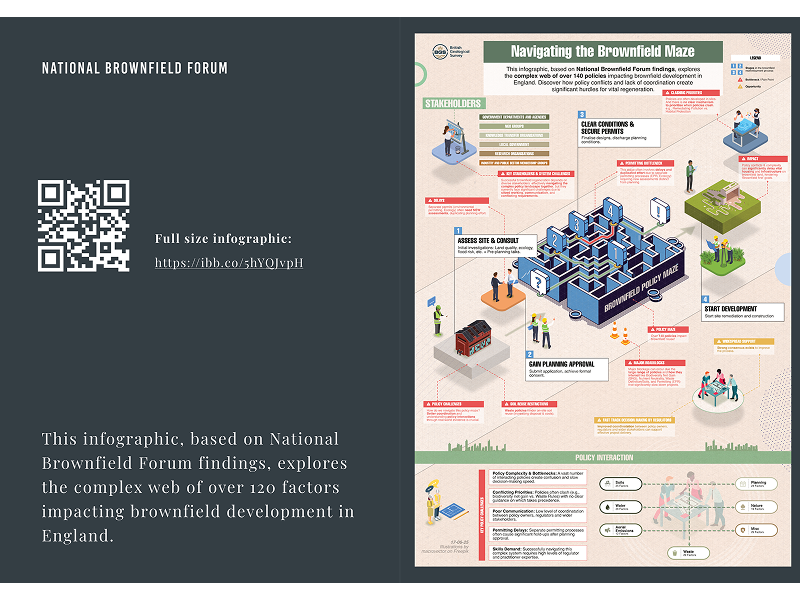
Transforming dense policy research into engaging, actionable insights for government stakeholders and industry professionals